Survival Prediction Calculator

About the Model
The concept for the Dialysis vs. Kidney Transplant- Estimated Survival in Ontario website was developed by Emory University and a team of researchers at Emory University, including Rachel E. Patzer, PhD, MPH, Mohua Basu, MPH, Michael Konomos, MS, Michael Patzer, BS, Christian Larsen, MD, DPhil, William M. McClellan, MD, MPH, David Howard, PhD, and Kimberly Jacob Arriola, PhD, MPH. The website is not sponsored or endorsed by Emory or otherwise connected with Emory. The data used to externally validate the models created by the Emory University team of researchers is based on Ontario data from 2011-2024 and then was translated into a website. Data was validated by a team of Canadian researchers https://pubmed.ncbi.nlm.nih.gov/30302267/
https://pubmed.ncbi.nlm.nih.gov/41978769/.
Development of Dialysis vs. Kidney Transplant- Estimated Survival in Ontario Risk Estimates
For information on how the original tool (iChoose Kidney) was created, please see ichoosekidney.emory.edu/about/estimate-development.html.
The original validation of the Dialysis vs. Kidney Transplant- Estimated Survival in Ontario tool used data from more than 20,000 incident adult patients receiving maintenance dialysis in Ontario and over 4000 kidney transplant recipients from January 1, 2004 to December 31, 2014, with follow-up through December 31, 2016. Logistic regression models were used to predict the 3-year risk of death for patients receiving maintenance dialysis vs. kidney transplant recipients. Predictive accuracy of the models was assessed using the c-statistic of the associated receiver operating characteristic (ROC) curve, which estimates the probability of concordance between the observed number of deaths and the predicted number of deaths based on the model. Model calibration was assessed by comparing the observed and expected number of deaths for each model. To further examine model calibration smoothed calibration plots were produced, including their intercepts, slopes and the Brier score. A correction factor was used to recalibrate intercepts of the model, when appropriate.1
We have now updated the model using more recent data from Ontario, Canada, removing race (as race can perpetuate racial bias in medicine when used in clinical algorithms) and restricting our dialysis population to patients with no recorded contraindications to kidney transplant (i.e., patients who are likely transplant eligible). To do this we excluded the following individuals: end-stage kidney disease-modified Charlson comorbidity index score ≥7 [higher score indicates more comorbidity], home oxygen use, dementia, living in a long-term care facility, received at least one physician house call in the past year, and select malignancies (i.e., lung cancer, lymphoma, cervical cancer, colorectal cancer, liver cancer, active multiple myeloma, bladder cancer). From January 1, 2011, to August 31, 2021, we included 24,793 patients receiving maintenance dialysis and 5,398 kidney transplant recipients. The maximum follow-up was August 31, 2024.
Translation of Risk Estimates into a Risk Calculator
To transform our model coefficients (examples provided below) into an individualized 3-year mortality estimate the equation below was used2:
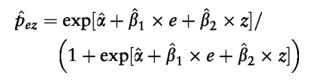
3-year mortality risk for a patient receiving maintenance dialysis is derived from the formula below:
-3.1319 (intercept) + 0.0067(Sex) + 0.0388(Age) + 0.4737(Cardiovascular disease) -0.4696(Hypertension) + 0.0169(Diabetes)
3-year mortality among kidney transplant recipients is derived from the formula below:
-5.14242 (intercept) -0.0475(Sex) + 0.0382(Age) + 0.3369(Cardiovascular disease) -0.2(Hypertension) + 0.4013 (Diabetes) + 0.136 (6-12 months on dialysis) + 0.4906(>12 months on dialysis)
3-year mortality among recipients of a deceased donor transplant is derived from the formula below:
-4.59048 (intercept) -0.1517(Sex) + 0.0391(Age) + 0.1732 (6-12 months on dialysis) + 0.1605(>12 months on dialysis) + 0.3080(Cardiovascular disease) -0.1801(Hypertension) + 0.2730 (Diabetes)
3-year mortality among recipients of a living donor transplant is derived from the formula below:
-6.01012 (intercept) -0.1231(Sex) + 0.0364(Age) + 0.0614(6-12 months on dialysis) + 0.3202(>12 months on dialysis) + 0.5908(Cardiovascular disease) -0.1417(Hypertension) + 0.4418 (Diabetes)
Where baseline risk=exp (intercept); male=0, female= 1; 1=yes and 0=no for cardiovascular disease, hypertension, diabetes, 6 to 12 months, >12 years on dialysis. Age is modeled as a continuous integer variable.
Note: The comparison of risk estimates for living versus deceased donor kidney transplants presumes that a kidney from either donor type would be received on the same day.
In this case, a 50-year-old male with a history of diabetes and hypertension who has been on dialysis for >12 months has a predicted probability of dying over the next 3 years of 16% on dialysis and 7% with a kidney transplant (relative risk of dying on dialysis vs. transplant is 2.3). Predicted probability of dying within the next three years with a deceased donor transplant (8%) is approximately 2.7 times higher than the predicted probability of dying with a living donor transplant (3%).
Prediction Model Discrimination and Performance
We performed an external validation of the risk prediction models for 3-year mortality in the dialysis and transplantation populations using Ontario data. The discriminatory ability of the model for 3-year mortality was moderate for dialysis (area under the curve [AUC] = 0.67 [95% confidence interval [CI]: 0.66, 0.68] and for transplant (AUC =0.74 [95% CI: 0.72,0.77]). The AUC was 0.71 (95% CI: 0.68, 0.73) for deceased donor transplant and 0.72 (95% CI: 0.65, 0.79) for living donor transplant.
Acknowledgement
This study was supported by ICES, which is funded by an annual grant from the Ontario Ministry of Health (MOH) and the Ministry of Long-Term Care (MLTC). This document used data adapted from the Statistics Canada Postal CodeOM Conversion File, which is based on data licensed from Canada Post Corporation, and/or data adapted from the Ontario Ministry of Health Postal Code Conversion File, which contains data copied under license from ©Canada Post Corporation and Statistics Canada. Parts of this material are based on data and/or information compiled and provided by the Canadian Institute for Health Information and the Ontario Ministry of Health. The analyses, conclusions, opinions and statements expressed herein are solely those of the authors and do not reflect those of the funding or data sources; no endorsement is intended or should be inferred. Parts of this material are based on data and information provided by Ontario Health (OH). The opinions, results, view, and conclusions reported in this paper are those of the authors and do not necessarily reflect those of OH. No endorsement by OH is intended or should be inferred.
References:
1.
Janssen KJ, Moons KG, Kalkman CJ, Grobbee DE, Vergouwe Y. Updating methods improved the performance of a clinical prediction model in new patients. J Clin Epidemiol. 2008;61(1): 76-86.
2.
Muller CJ and MacLehose RF. Estimating predicted probabilities from logistic regression: different methods correspond to different target populations. International Journal of Epidemiology. 2014; 43 (3); 962–970.